Farmers Who Applied Less Nitrogen Made $65 More Per Acre in 2025. Here’s What 11 Years of Data Shows.
In 2025, 68% of high-productivity corn fields in PCM’s dataset received more than 200 pounds of nitrogen per acre. That same year, fields applying less than 150 pounds netted $65 more per acre than fields applying over 225.
We should note that this is not a controlled research project, so other management factors fluctuated. But this illustrates an important social principle that we observe every year: some farmers have a low-cost mindset and others have a maximum-production mindset. In this economy, the low-cost mindset is most profitable.
That $65 gap between farmers applying the lowest N rates and those applying more is real, and it’s consistent with a pattern that has held across all 11 years of PCM data.*
What the Data Shows
Every year since PCM began collecting field-level data in 2015, the most profitable nitrogen application rate has been below 200 lbs N/acre. In most years, the 151–175 lb range comes out on top. In 2025 specifically — a low-margin, high-cost year — the most profitable fields were applying less than 150 lbs total, even though a majority of the corn fields in PCM’s dataset received more than 200 lbs N/acre.
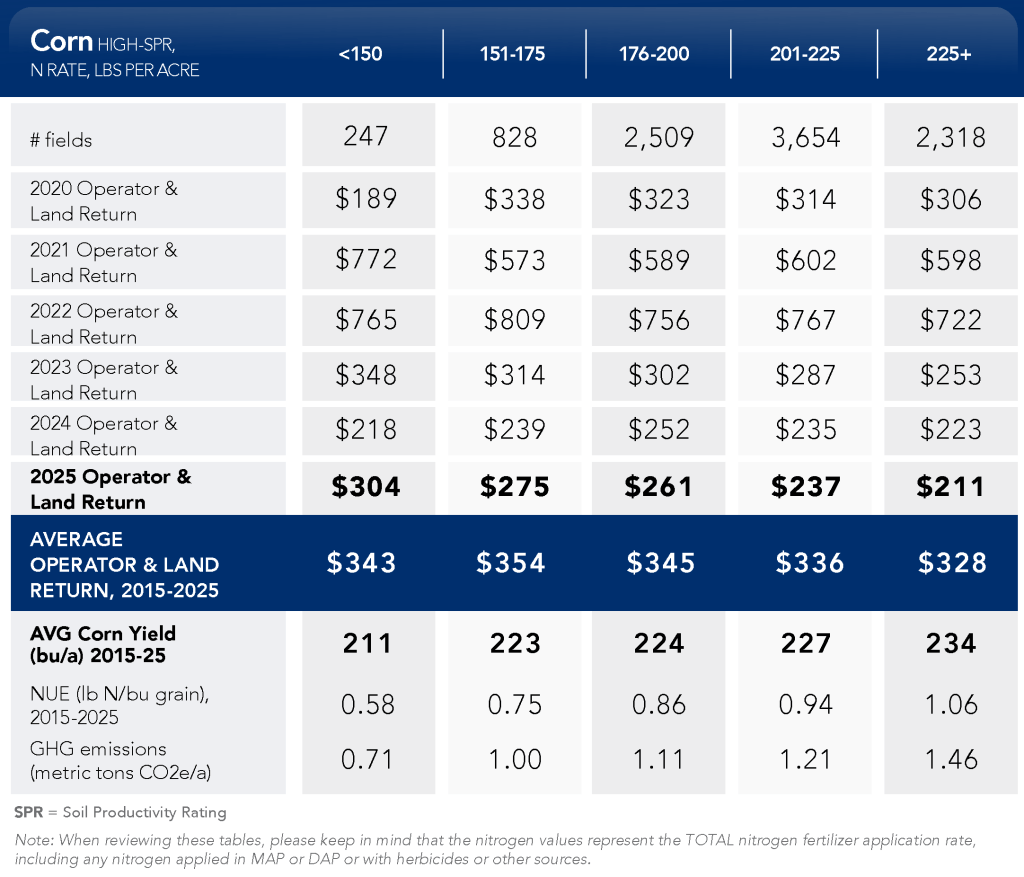
That’s total nitrogen: everything in your anhydrous, your MAP or DAP, your burndown, your UAN. All of it.
“I’ve seen firsthand how the farmers I work with have been able to increase the efficiency of their nitrogen inputs with reduced rates and improved application timing,” says PCM Specialist Andrew Hiser, who works directly with farmers in central Illinois. “By analyzing their field-level data to make informed management decisions, they’re able to identify areas where the additional cost of more nitrogen doesn’t always translate to more profit. Seeing these results on their own operations as well as hearing of similar outcomes from other PCM farmers has helped them build the confidence needed to continue making the right choices for their farms.”
A Helpful Tool for Determining Your N Rate
The University of Illinois Maximum Return to Nitrogen (MRTN) tool can help farmers predict the most profitable N rate range based on current market conditions, fertilizer prices, and location.
“Since 2015, the MRTN points to the 151–175 lb range about half of the time for corn fields in Central IL and 176-200 lbs/a the other half, depending on corn price and nitrogen fertilizer costs. And, if anything, it leans toward slightly overestimating the rate rather than underestimating the most profitable range,” says Dr. Laura Gentry, Director of Water Quality at IL Corn.
Farmers applying above the MRTN rate are spending money that isn’t coming back. More nitrogen does produce more corn, but it doesn’t produce enough extra corn to pay for itself above a certain point.
Why This Data Exists
PCM was founded in 2015 by IL Corn in direct response to the Illinois Nutrient Loss Reduction Strategy — a state initiative aimed at reducing nutrient runoff into waterways. The goal from day one has been to find conservation practices that work for farmers financially, not just environmentally.
Nitrogen management turned out to be exactly that kind of practice. Reducing rates to the MRTN range cuts input costs, improves net returns, and reduces nitrate loss from fields without sacrificing profitability. It’s one of the clearest win-win scenarios in our dataset.
What to Do with This Information
“Farmers who are applying over 200 pounds of nitrogen per acre are generally less profitable than farmers applying rates within the MRTN range,” says Gentry.
If your rates are consistently above 200 lbs/acre, we encourage you to look at your financial data closely. Look at your total N across all sources — not just your primary application — and compare it to the MRTN for your region and price environment.
PCM Specialists work with enrolled farmers every year to do exactly this kind of analysis using their own field-level data, not averages from someone else’s farm. If you want to see how your nitrogen rates compare to the most profitable fields in your area, consider enrolling in PCM for a free annual analysis.
Dr. Laura Gentry and Dr. Gary Schnitkey walk through the full nitrogen findings — including the year-by-year breakdown — at 31:07 in the video below.
*Please note that this is for High-SPR Soils in Illinois.
The full 2026 PCM Business Case for Conservation is also available as a free download.